Interaction of lignin dimers with model cell membranes - A quartz crystal microbalance and molecular dynamics simulation study
The interactions of three lignin dimer derivatives with DPPC and DOPC lipid bilayers were studied using quartz crystal microbalance with dissipation (QCM-D) experiments and molecular dynamics (MD) simulations.
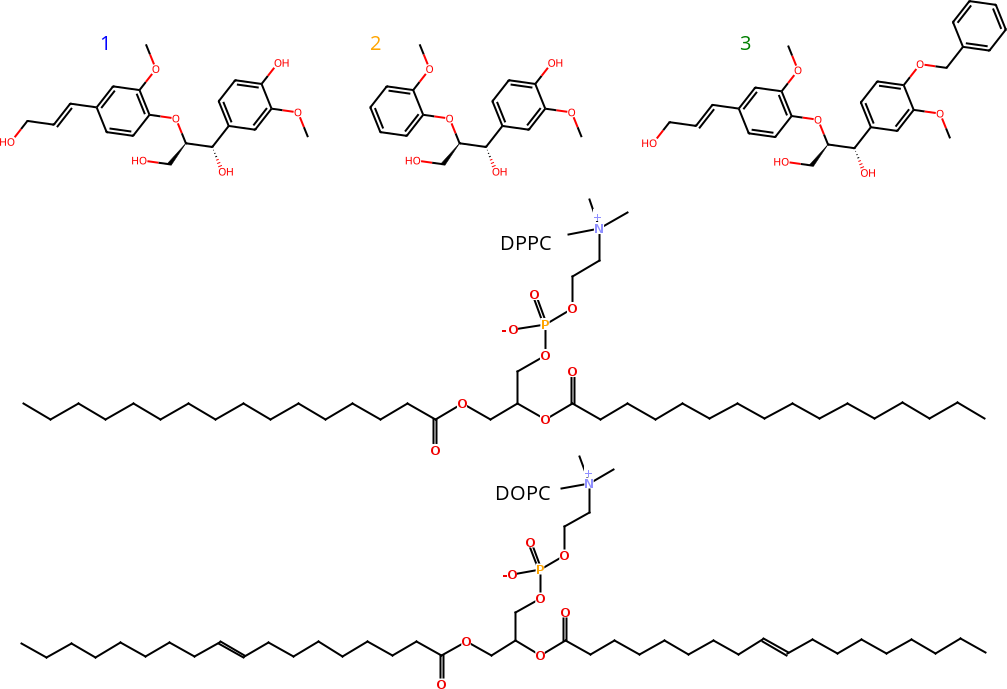
Figure 1: Chemical structures of lignin dimer derivatives (1-3), and DPPC and DOPC lipids.
The QCM-D data showed that the mass of lignin dimers inside the bilayer (per unit mass of lipids) and energy dissipation (a measure of bilayer disorder) were higher for dimers 2 and 3 compared to dimer 1 in gel-phase DPPC bilayers. In fluid-phase DOPC bilayers, the uptake of dimer 2 was similar, indicating that the bilayer phase has little effect on dimer uptake. Note that in the QCM-D experiments, they tried to wash any dimers off of the surface of the bilayer so they could measure only the mass of dimers in the bilayer interior.
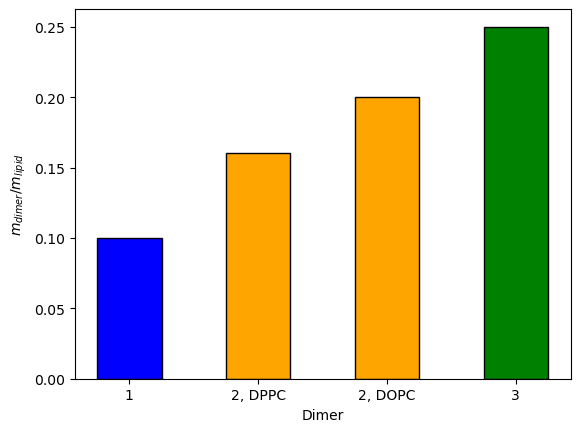
Figure 2: Mass of dimers (mdimer) relative to the mass of lipids (mlipid) obtained from QCM-D.
The results of MD simulations on the dimers in fluid-phase DPPC lipid bilayers could qualitatively explain the QCM-D mass results. We conducted unbiased simulations at various dimer concentrations to obtain density profiles and free energy calculations (potential of mean force). These simulations revealed that while dimer 1 strongly adhered to the bilayer-solution interface, it did not have a significant presence inside the bilayer (also refer to Figures 2 and 3 here). However, dimers 2 and 3 showed a significant presence inside the bilayers, but had lower overall affinity towards them. The QCM-D experiments also showed that dimer 1 had a strong affinity for the bilayer surface, as it was harder to wash away compared to the other two dimers.
Figure 3 below shows the potential of mean force (PMF) profiles. Dimer 1 has the deepest minimum indicating that it has the highest affinity for the bilayer. However, the dimer 1 PMF curve increases steeply in the hydrophobic region of the bilayer which indicates it is unfavorable to move into the bilayer interior. Dimer 1 mostly piles up near the bilayer-solution interface. The penalty for dimers 2 and 3 to move into the bilayer interior is relatively small, so they can reside in the bilayer-solution interface region and the bilayer interior.
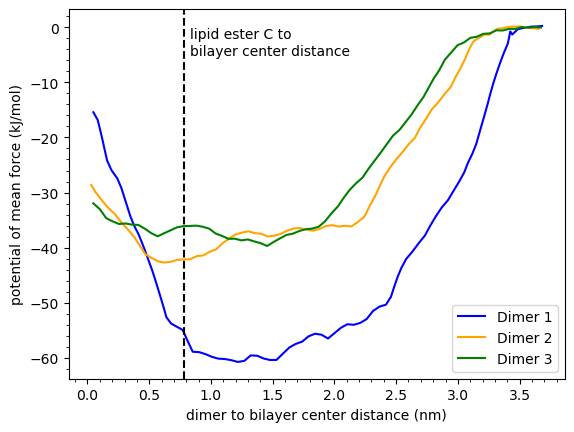
Figure 3: Potential of mean force (PMF) as a function of the dimer distance from the bilayer center along the bilayer normal direction. The dashed line is the average position of the lipid ester carbons which is the approximate boundary between the hydrophobic bilayer interior and the more hydrophilic bilayer-solution interface region. The dimer mole fractions relative to the lipids are 0.289.
By looking at the average distance of dimers from the bilayer center as a function of dimer concentration, we determined very approximate dimer concentrations associated with saturation of the bilayers with dimers. Then mass ratios of different dimers associated with the bilayers could be estimated. The MD mass ratio of dimer 2 to dimer 1 of greater than 3.7 was qualitatively consistent with the corresponding QCM-D mass ratio of 1.6.
When the dimers were added to the bilayers, the QCM-D dissipation increased. This indicates that the stiffness of the bilayer decreased due to the presence of dimers. Dimer 2 and 3 caused a much larger change in dissipation compared to dimer 1. MD simulations also showed that lipid tail order, bilayer thickness, and bilayer compressibility indicated a greater decrease in stiffness after adding dimers 2 and 3 compared to dimer 1.